Outcome of Data Analysis
Data were validated through rigorous review for quality and consistency and also via pairwise comparison with data from other sources. For example, GDP data from 2011 to 2020 were sourced and validated on the World Bank Open Data Platform (WBODP) and pairwise checked with data from Data Reportal. Data on Internet Penetration (IP) was sourced from the regulators’ website and therein validated. In certain instances where data was not available on regulators’ website, data from Data Reportal was used.
Data Analysis
Data obtained were analyzed with the aim to establish a significant correlation between select national GDP and Internet Penetration and Cybersecurity. The Pearson Correlation coefficient of GDP data and those of the Internet Penetration and Cybersecurity were computed. The percentage of correlated and non-correlated national data was also computed.
Detailed analysis showed that:A. In Africa:
4. Cybersecurity maturity correlates with GDP @ 0.3 (30%). A weak positive
correlation with GDP.
5. Cybersecurity correlates with IP @ 0.66 (66%). A strong correlation for which 93% (37) of countries have positive Cybersecurity correlation with IP.
B. In Latin America:
8. Internet Penetration correlates with GDP @ 0.30 (30%). A weak positive
correlation for which 47% (7 countries) have positive Internet Penetration correlation with GDP.
9. Cybersecurity maturity correlates with GDP @ 0.3 (30%). A weak positive
correlation for which 36% (5) have positive Cybersecurity maturity correlation with GDP.
10. Cybersecurity correlates with IP @ 0.6 (60%). A strong correlation for which 71% of countries have positive Cybersecurity correlation with IP.
C. In Asia/Middle-East:
11. A 10% increase in Internet Penetration yields per capita average growth of
between US$1,898.15 and $4,149.20 being 5.5% and 12% of the per capita GDP. The nation with the highest 10% increase in Internet Penetration yield is Israel with US$11,786 per capita while the nation with the lowest yield is Japan with US$(7,357) per capita.
12.A 10% increase in Cybersecurity maturity yields per capita average growth of between US$1,518.52 and $3,319.36 being 4.5% and 9.8% of the per capita GDP. The nation with the highest 10% increase in Cybersecurity maturity yield is Israel with US$10,607 per capita while the nation with the lowest yield is Japan with US$(4,414) per capita.
13. Internet Penetration correlates with GDP @ 0.25 (25%). A weak positive
correlation for which 60% (9 countries) have positive Internet Penetration correlation with GDP.
14. Cybersecurity maturity correlates with GDP @ 0.4 (40%). A weak positive
correlation for which 64% (9) have positive Cybersecurity maturity correlation with GDP.
Note: Positive correlation is measured on a 0.1 to 1.0 scale. Weak positive correlation would be in the range of 0.1 to 0.3, moderate positive correlation from 0.3 to 0.5, and strong positive correlation from 0.5 to 1.0. The stronger the positive correlation, the more likely the subject data are to move in the same direction.
GDP/IP/CS Correlation / CS Maturity Index Table 1
|
Continent |
Sample Population (A) |
Correlation of IP to GDP (%) (B) |
Correlation of CS to GDP (%) (C) |
CS correlation with IP (%) (D) |
10% increase in IP produces average per capita GDP (USD) of - -- (E) |
10% increase in IP produce s average per capita GDP (USD) of ---- +ve Correlati on countries (F) |
10% increase in IP produces % per capita increase (low % - high %) (G) - (H) |
10% increase in CS produces % per capita increase (low % - high %) (DxG) - (DxH) |
CS Maturity Index (%) |
|
Africa |
40 |
32 |
30 |
66 |
31.00 |
256.00 |
1.0 - 8.2 |
0.66 - 5.4 |
29.1 |
|
Latin- America |
15 |
30 |
30 |
60 |
447.00 |
754.00 |
3 - 5.1 |
1.8 - 3 |
35.6 |
|
Asia/Middle- East |
15 |
25 |
40 |
82 |
1,898.15 |
4,149.20 |
5.5 - 12 |
4.5 - 9.8 |
61 |
GDP/IP/CS Correlation Graph 1

GDP/IP/CS Correlation Table 2
|
Continent |
Sample Populatio n (A) |
Correlation of IP to GDP (%) (B) |
Correlation of CS to GDP (%) (C) |
CS correlatio n with IP (%) (D) |
10% increase in IP produces average per capita GDP (USD) of ---- +ve Correlation countries (E) |
10% increase in IP produces % per capita increase (low % - high %) (F) - (G) |
10% increase in CS produces % per capita increase (low % - high %) (DxF) - (DxG) |
|
Africa |
15 |
23 |
20 |
70 |
233.00 |
4.8 - 7.4 |
3.36 - 5.18 |
|
Latin-America |
15 |
30 |
30 |
60 |
754.00 |
3 - 5.1 |
1.8 - 3 |
|
Asia/Middle-East |
15 |
25 |
40 |
82 |
4,149.20 |
5.5 - 12 |
4.5 - 9.8 |
GDP/IP/CS Correlation Graph 2
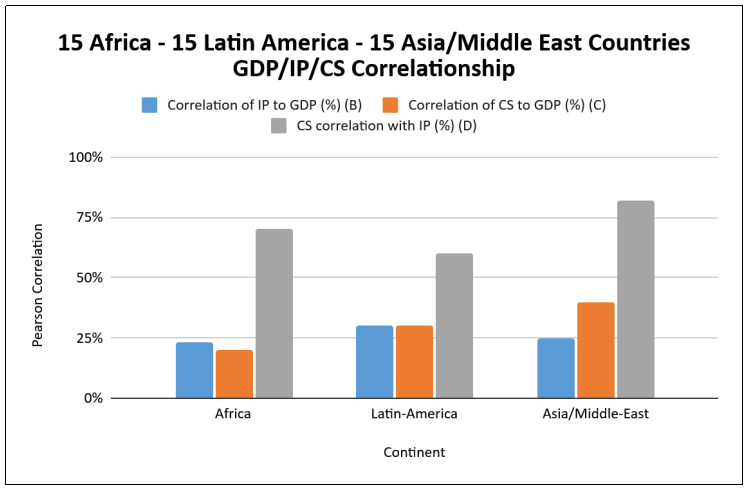
Data from Table 1 above revealed a strong Cybersecurity correlation with Internet Penetration indicating that CS is a measure of Internet technology, its acceptability by the people and its positive impact on their income. Considered on the same population sample of 15 countries each in Africa, Latin America and Asia/ME, a 10% increase in Cybersecurity maturity delivered per capita GDP increases between 3.36% & 5.18% for Africa, 1.8% to 3% for Latin America and 4.5% to 9.8% for Asia/ME provided that there is continuum in relevant governance policies of a given country such that there is no political and economic instability leading to policy somersault, capita flight and loss of confidence in the economy.